
Strappos brings data from every franchise location and connected system into one clear dashboard, giving leadership an up-to-date view of performance across the entire organization.
No waiting for reports. No collecting spreadsheets. No piecing together information from different systems.
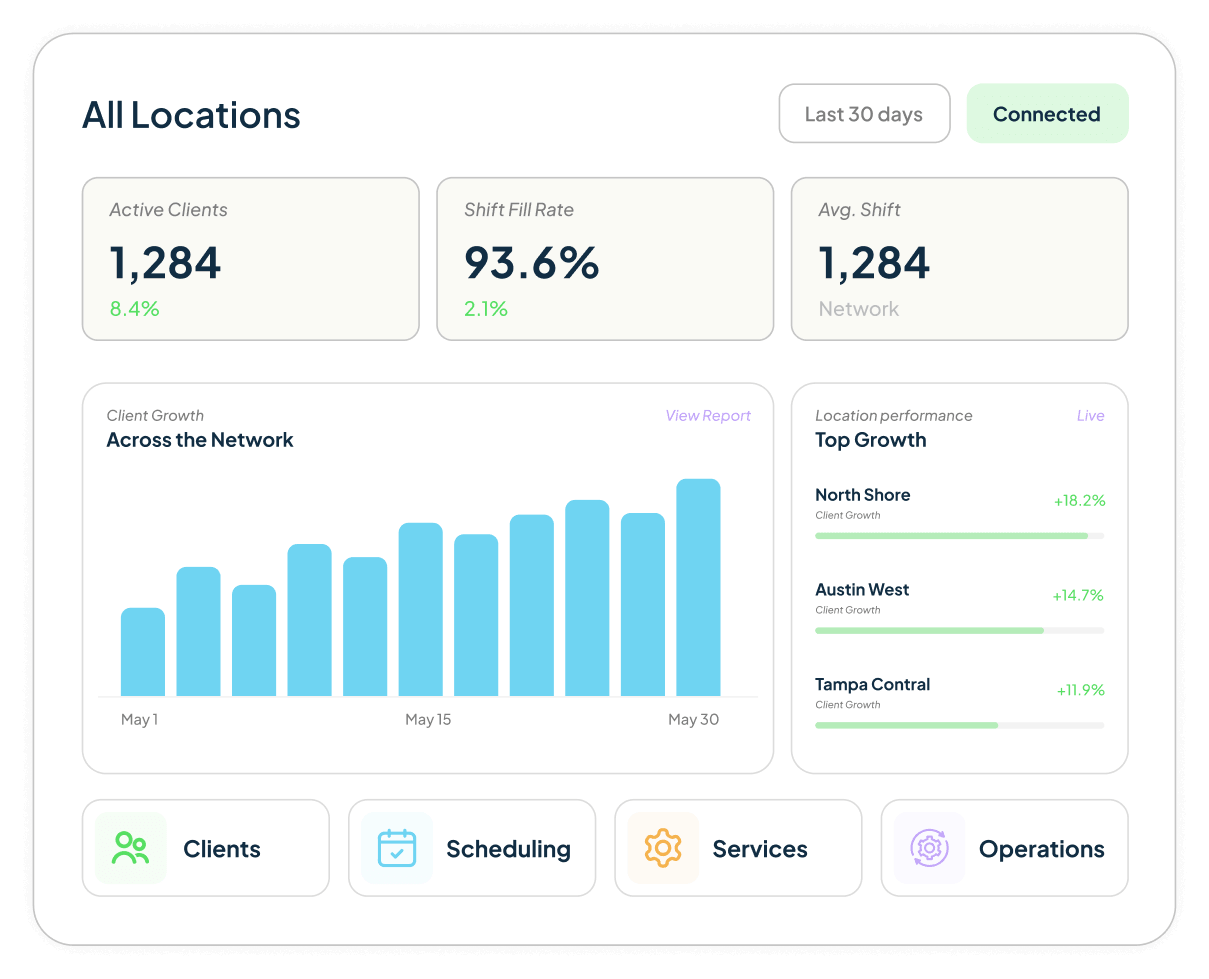





View the performance of your entire franchise network, then explore an individual location whenever you need more detail.
Compare locations, identify trends, and see where additional support or attention may be needed.
Strappos connects directly with the systems your franchise locations already use.
The data available in those systems can be organized into one consistent reporting experience, even when different locations use different technology.
Your dashboard is built around the questions that matter to your franchise.
Track the metrics you already rely on, create
new reports, or use AI to help uncover
the information you’re looking for.
Your dashboard can bring together the operational data most important to your organization.
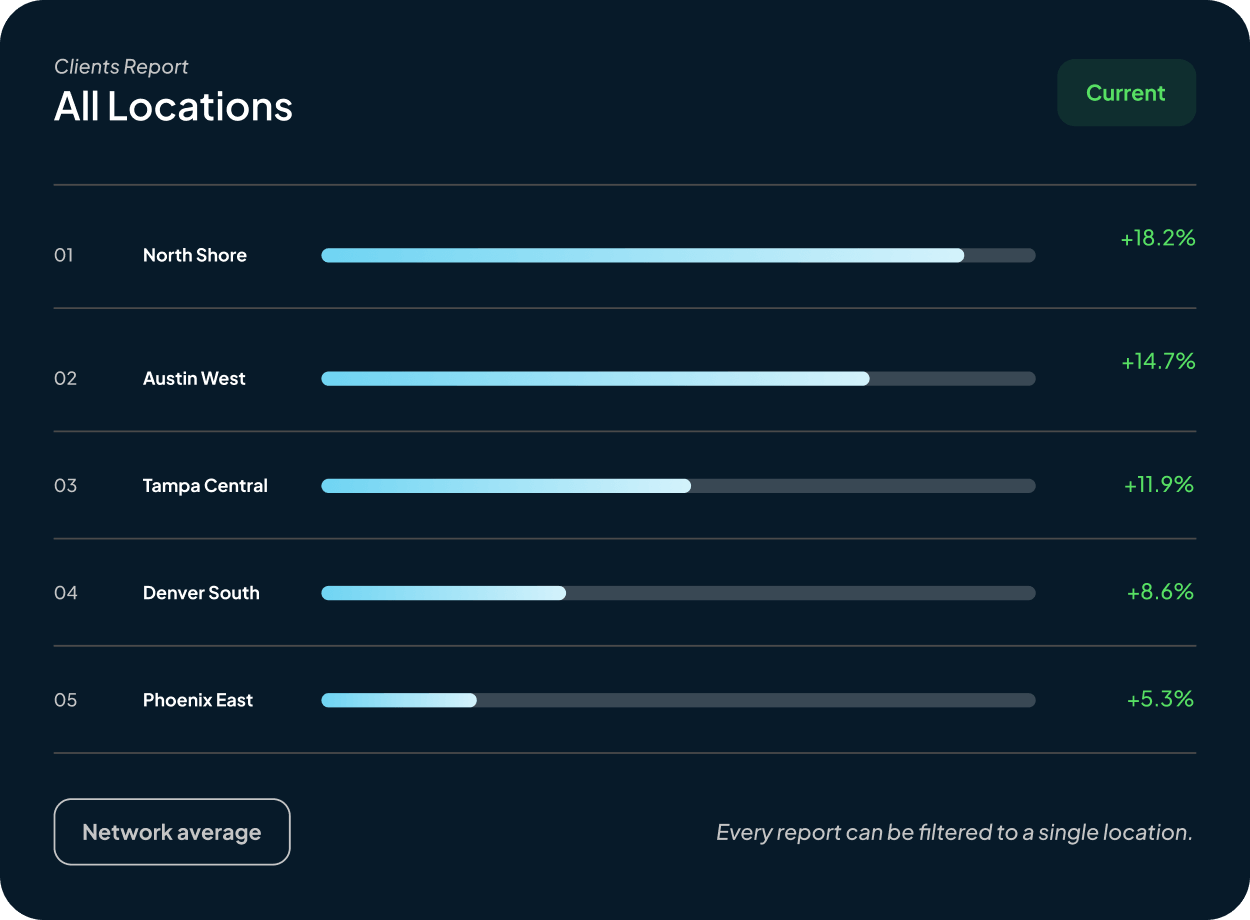
Understand where your client base is growing, where retention is strongest, and how performance compares across locations.
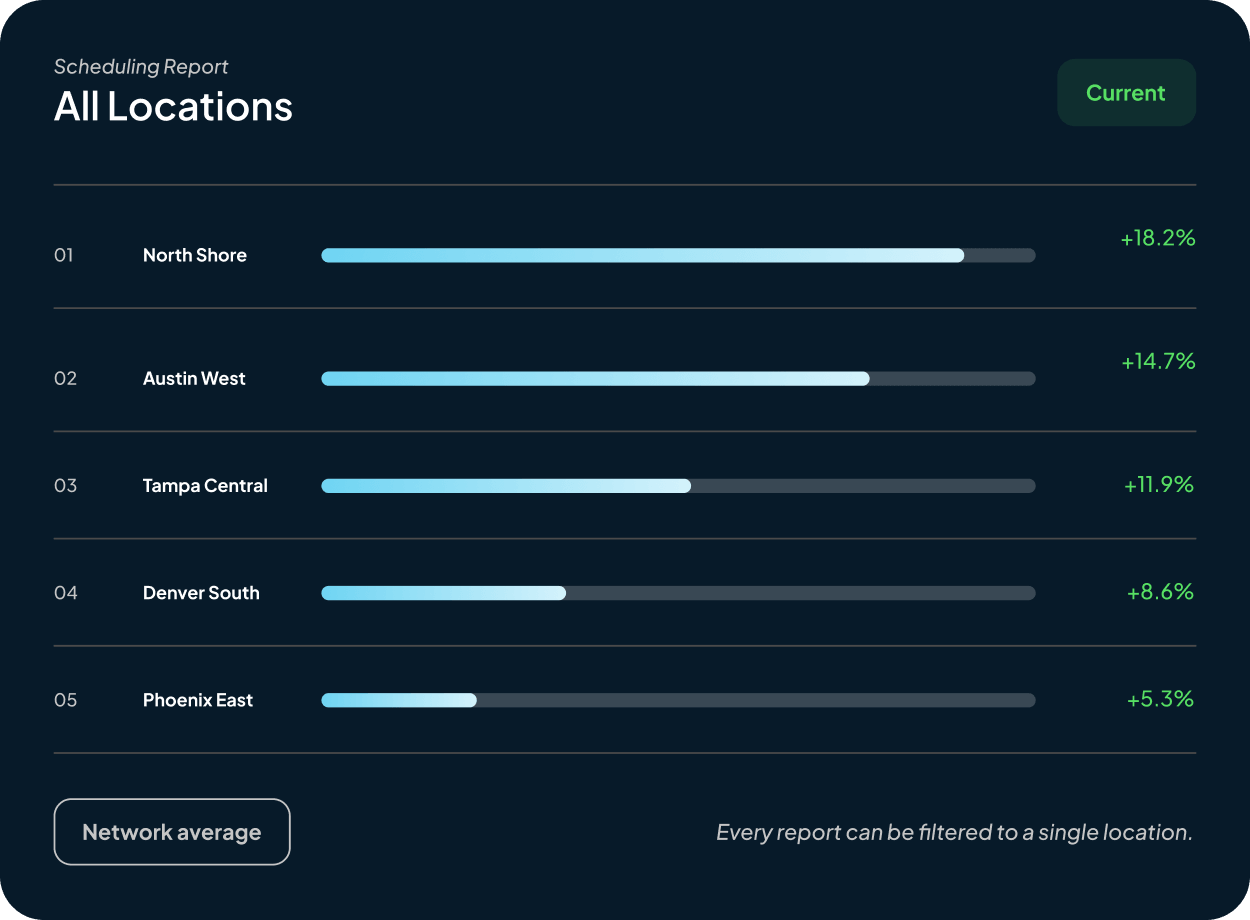
See how effectively every location is filling demand, where cancellations are increasing, and how quickly open work is covered.
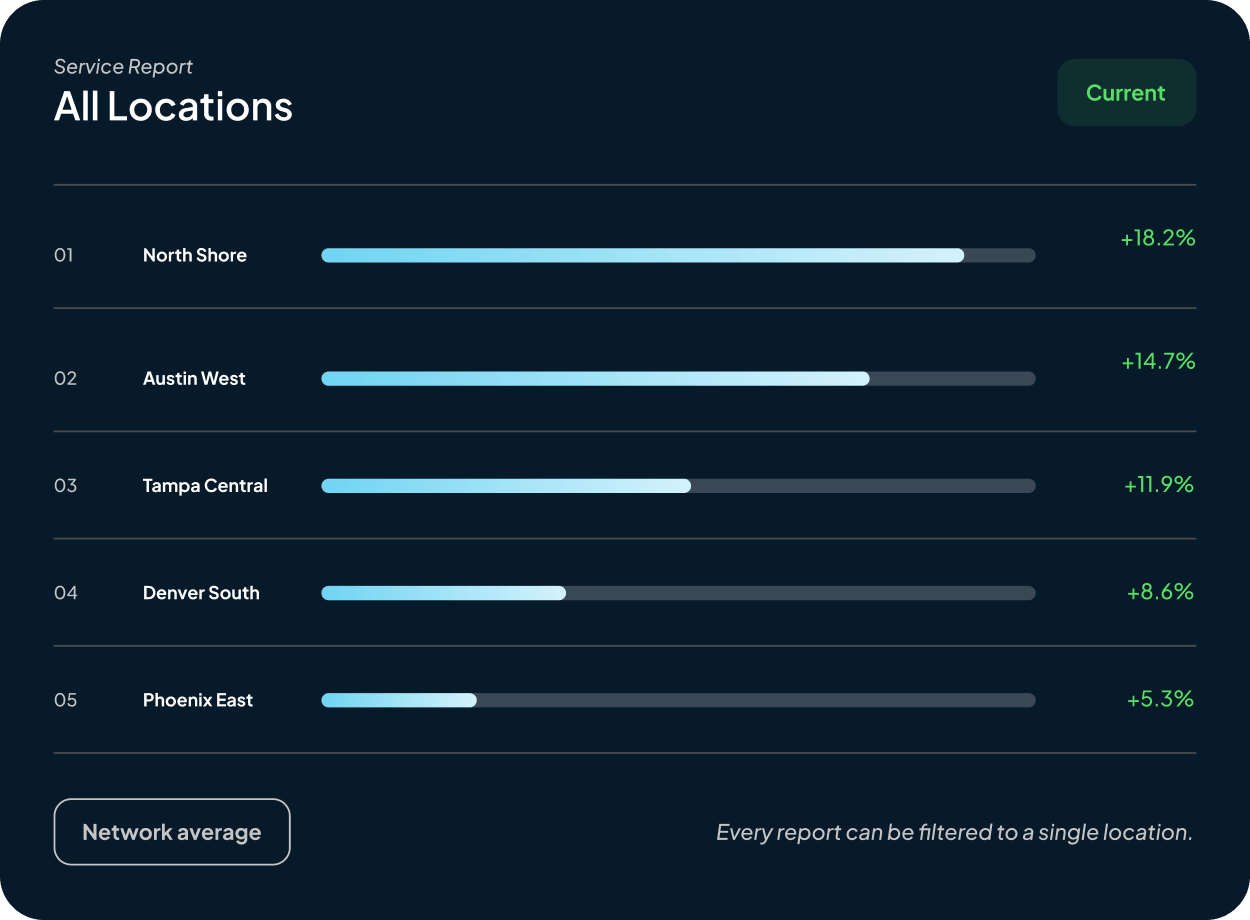
Identify the services customers use most, which offerings are growing, and how utilization differs throughout the network.
Compare activity and workflow performance across every location, then identify where leadership can provide the right support.
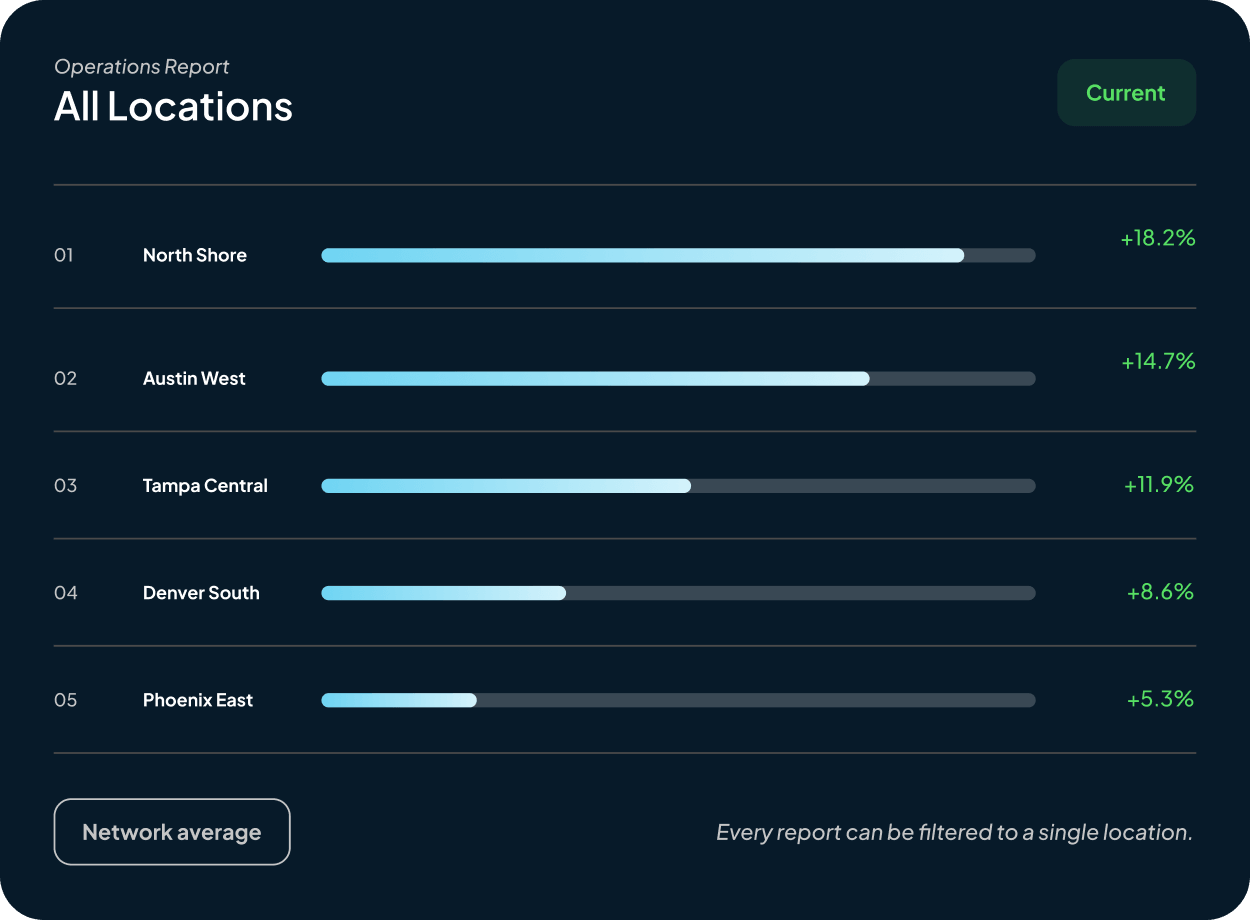

Strappos can build your dashboard around the systems, services, terminology, and performance indicators that matter to your network.
You shouldn’t need to know which system holds the answer or spend hours building the right spreadsheet.
Use AI to explore connected franchise data, create reports, compare
performance, and identify trends across the network.
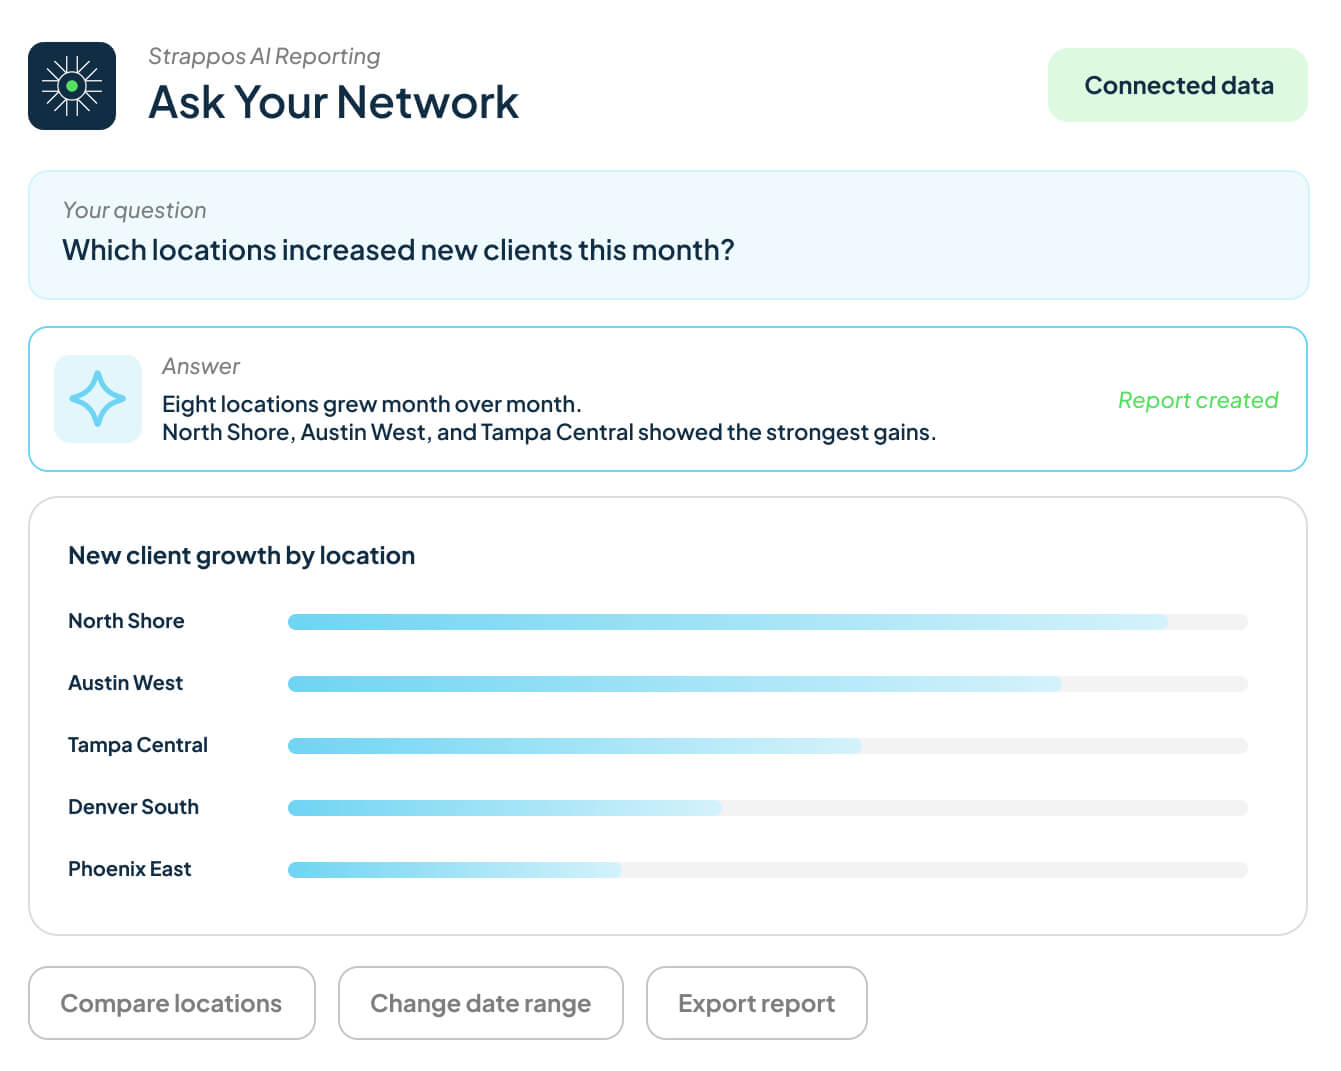
Strappos helps turn those questions into clear, useful reports using the data available across your connected systems.